Enabling researchers to compare multiple variants in Maze studies
Solution:
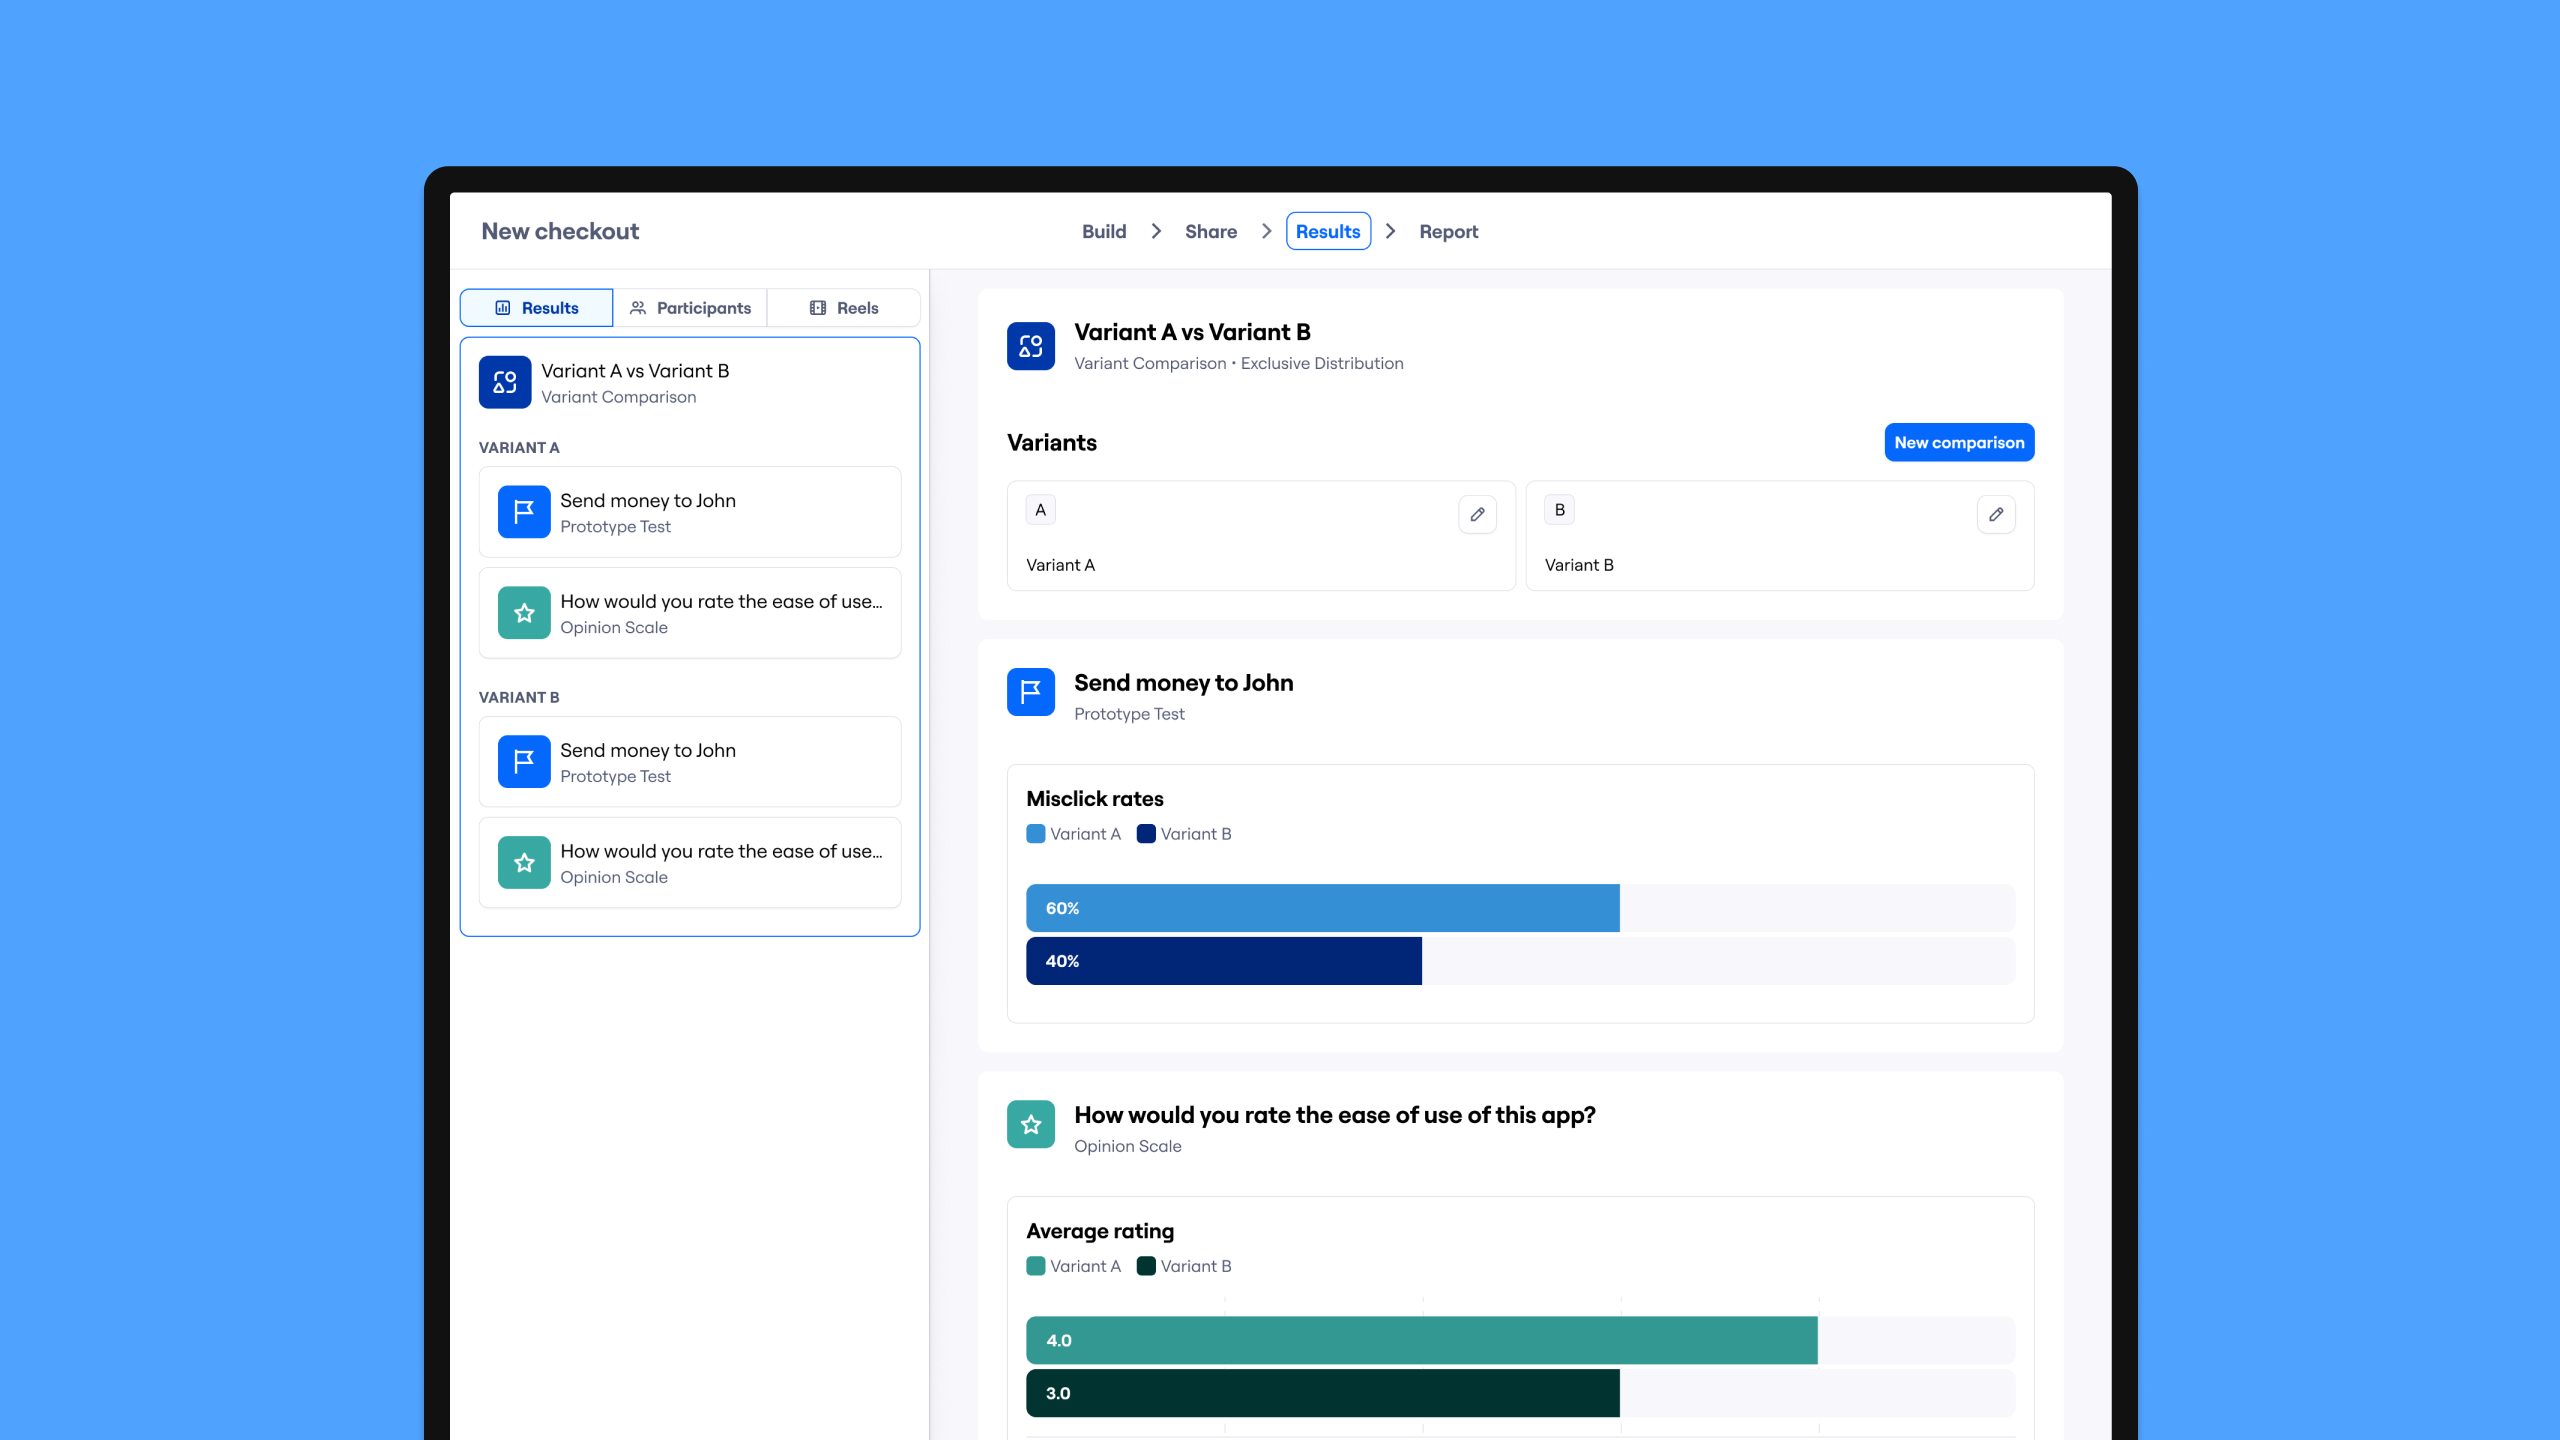
The new Variant Comparison block, a flexible end-to-end system for unmoderated research comparisons with setup flexibility and at-a-glance results comparisons, with a brand new data visualization system.
Role:
I was the only product designer, working with a PM, three engineers, and a copywriter.
Maze is an all-in-one research platform that helps designers, researchers, and product managers rapidly collect, analyze, and incorporate user feedback across the product life cycle.
Our most requested feature, representing over $2M ARR, was a way for customers to compare multiple variants of their designs to identify the best-performing one in terms of usability and desirability.
Customers relied on manual workarounds that led to uneven participant distribution, limited recruitment options, and poor scalability.
Because comparisons affect research validity, these limitations risked misleading product decisions.
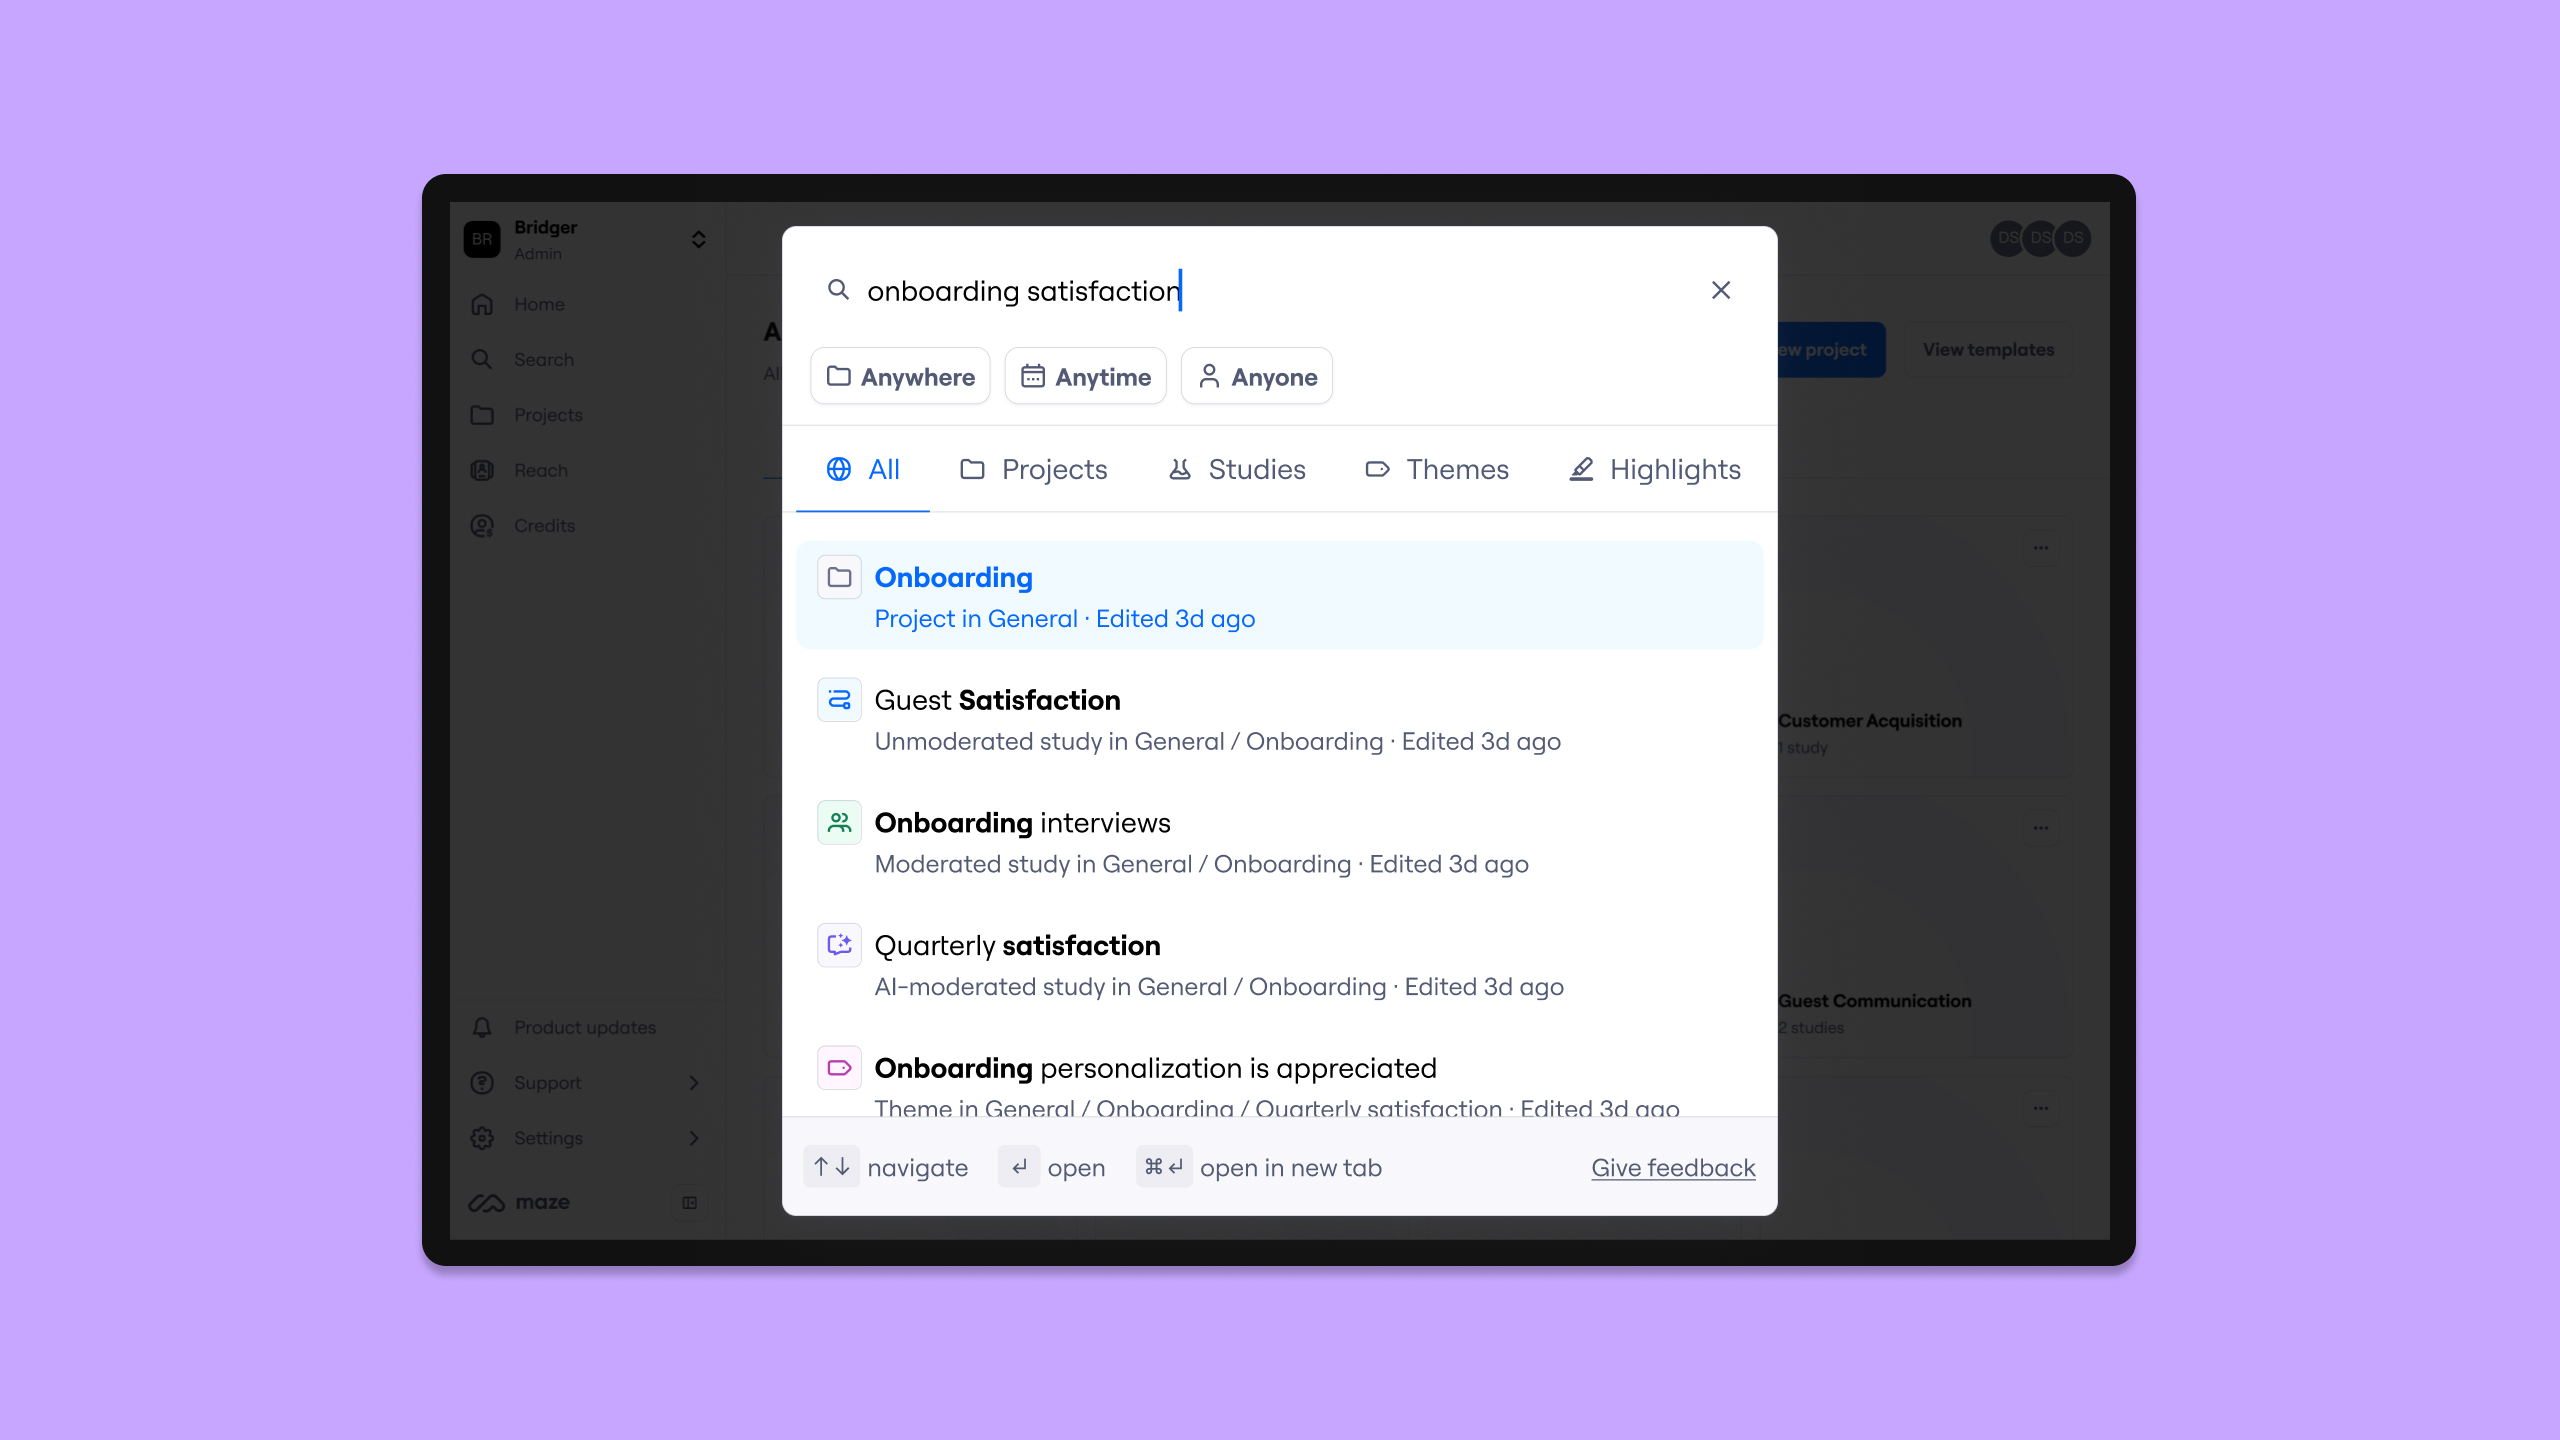
How might we help researchers compare multiple solutions, with reliable and unbiased results that are easy to understand at a glance?
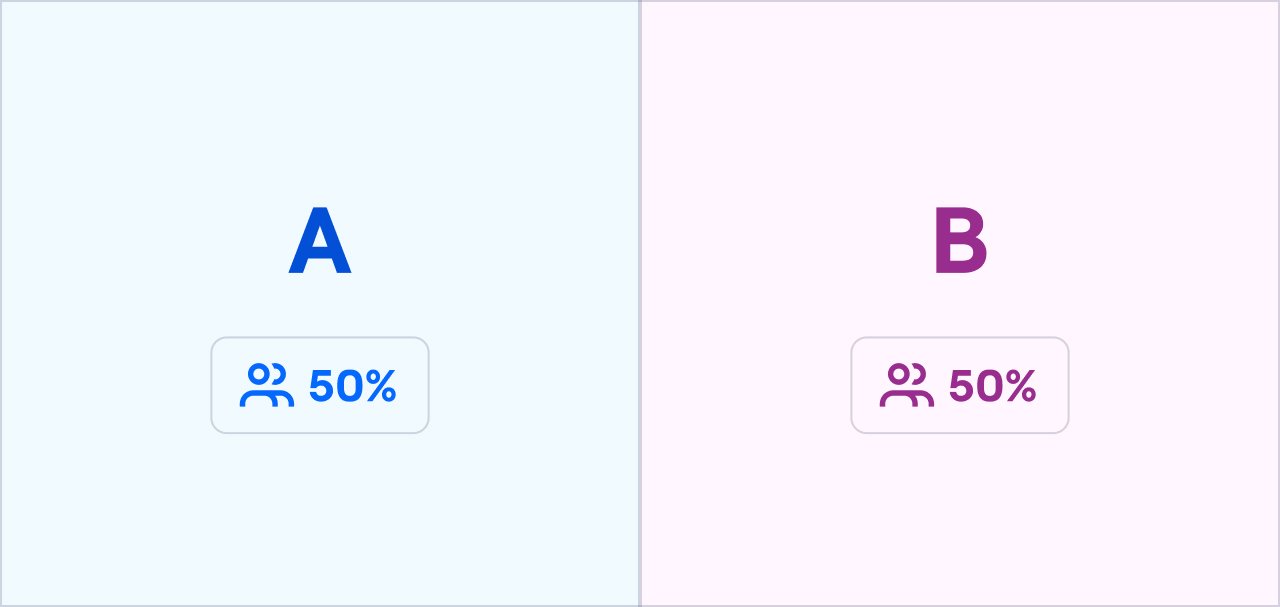
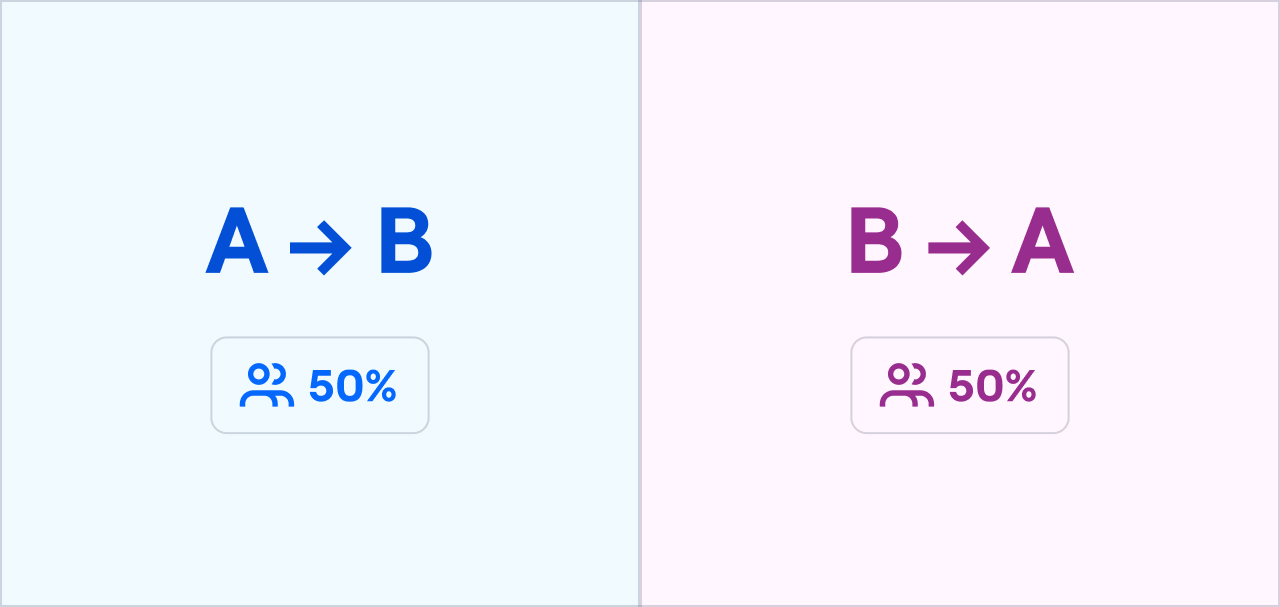
Initial research from our in-house researcher identified two comparison distribution approaches:
However, some key questions were still open:
- Would comparisons be limited to prototypes, or extend to other research artifacts?
- Should supporting questions be identical for rigor, or allow flexibility?
- Should results point to a single “winning” variant?
These uncertainties sparked internal debate and early design exploration.
To challenge these assumptions early, I created an opinionated prototype covering both setup and results and ran concept interviews with seven enterprise customers.

Customer reactions from the interviews fundamentally shifted the direction of the work:
- Use cases go beyond prototypes: Comparisons were often used to unbias decisions around copy, flows, or content, sometimes without any prototype at all. This directly influenced how we named and positioned the feature.
- Flexibility matters more than symmetry: While many supporting questions were shared, researchers often needed variant-specific ones. Forced symmetry reduced insight quality.
- There is rarely a single winner: Decisions were usually based on synthesis and tradeoffs rather than a single best-performing option.
To manage risk and complexity, I sequenced the work in 3 phases:
1. Block setup: Enable comparisons through a new, flexible block.
2. Quantitative comparisons: Make comparisons results easy to understand, a key differentiator from our competitors.
3. Qualitative comparisons: Extend comparisons to open-ended text data.
This allowed us to unlock value early, before tackling harder data viz challenges.
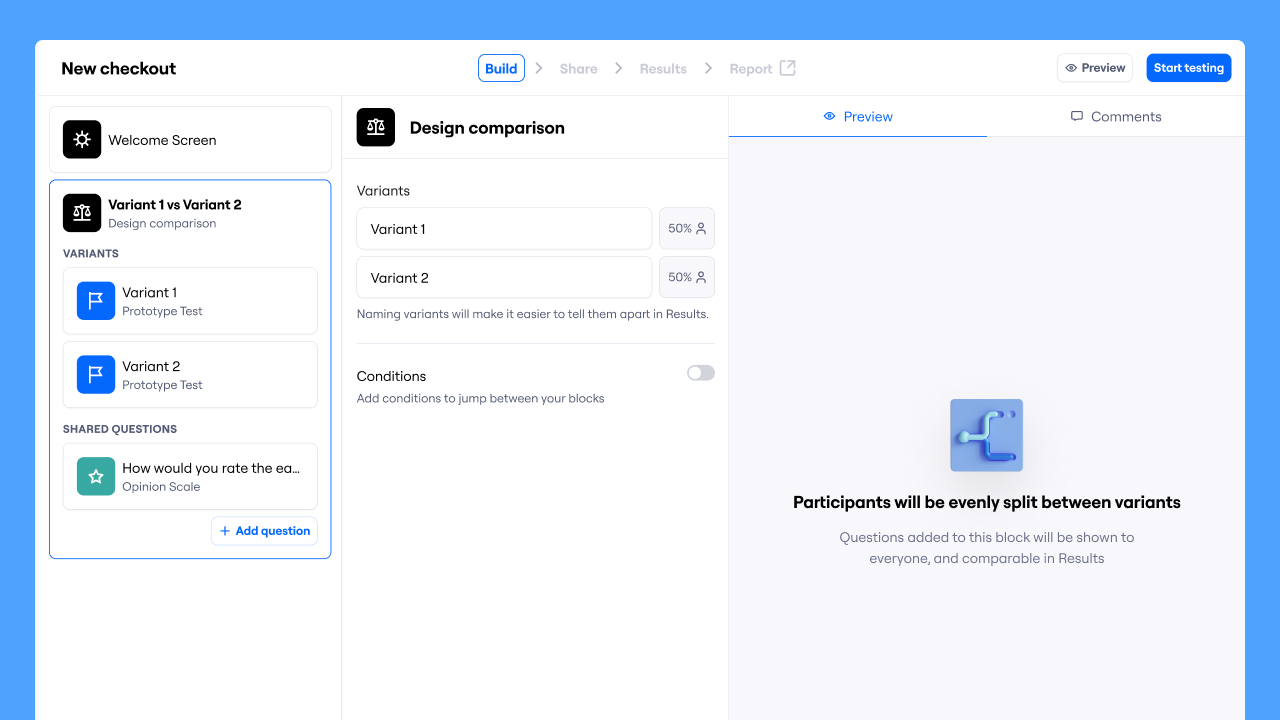
The first iteration focused on the Variant Comparison block setup, with flexibility as a core principle.
After design critiques and stakeholder alignment, we launched an async Maze study to test usability and copy. Through iterative testing, we landed on describing the distribution methods as Exclusive and Alternating.
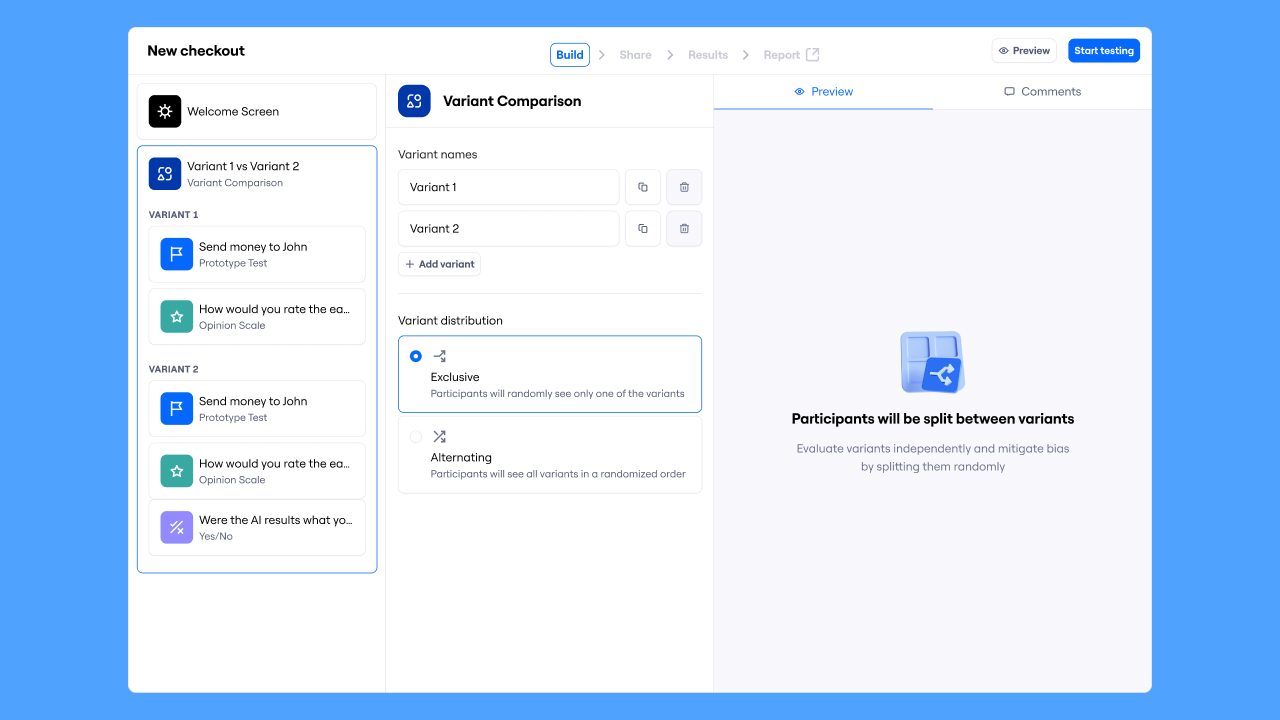
We shipped the setup experience alongside a continuous feedback survey, which became a long-term signal and a recruiting source for follow-up interviews.
This phase focused on clear, responsible sense-making in results, guided by the principle that comparisons should support interpretation, not declare verdicts, since product decisions are often based on tradeoffs.
This became a key differentiator for Maze, as competitors lacked side-by-side result comparisons, limiting how clearly users could reason about differences.
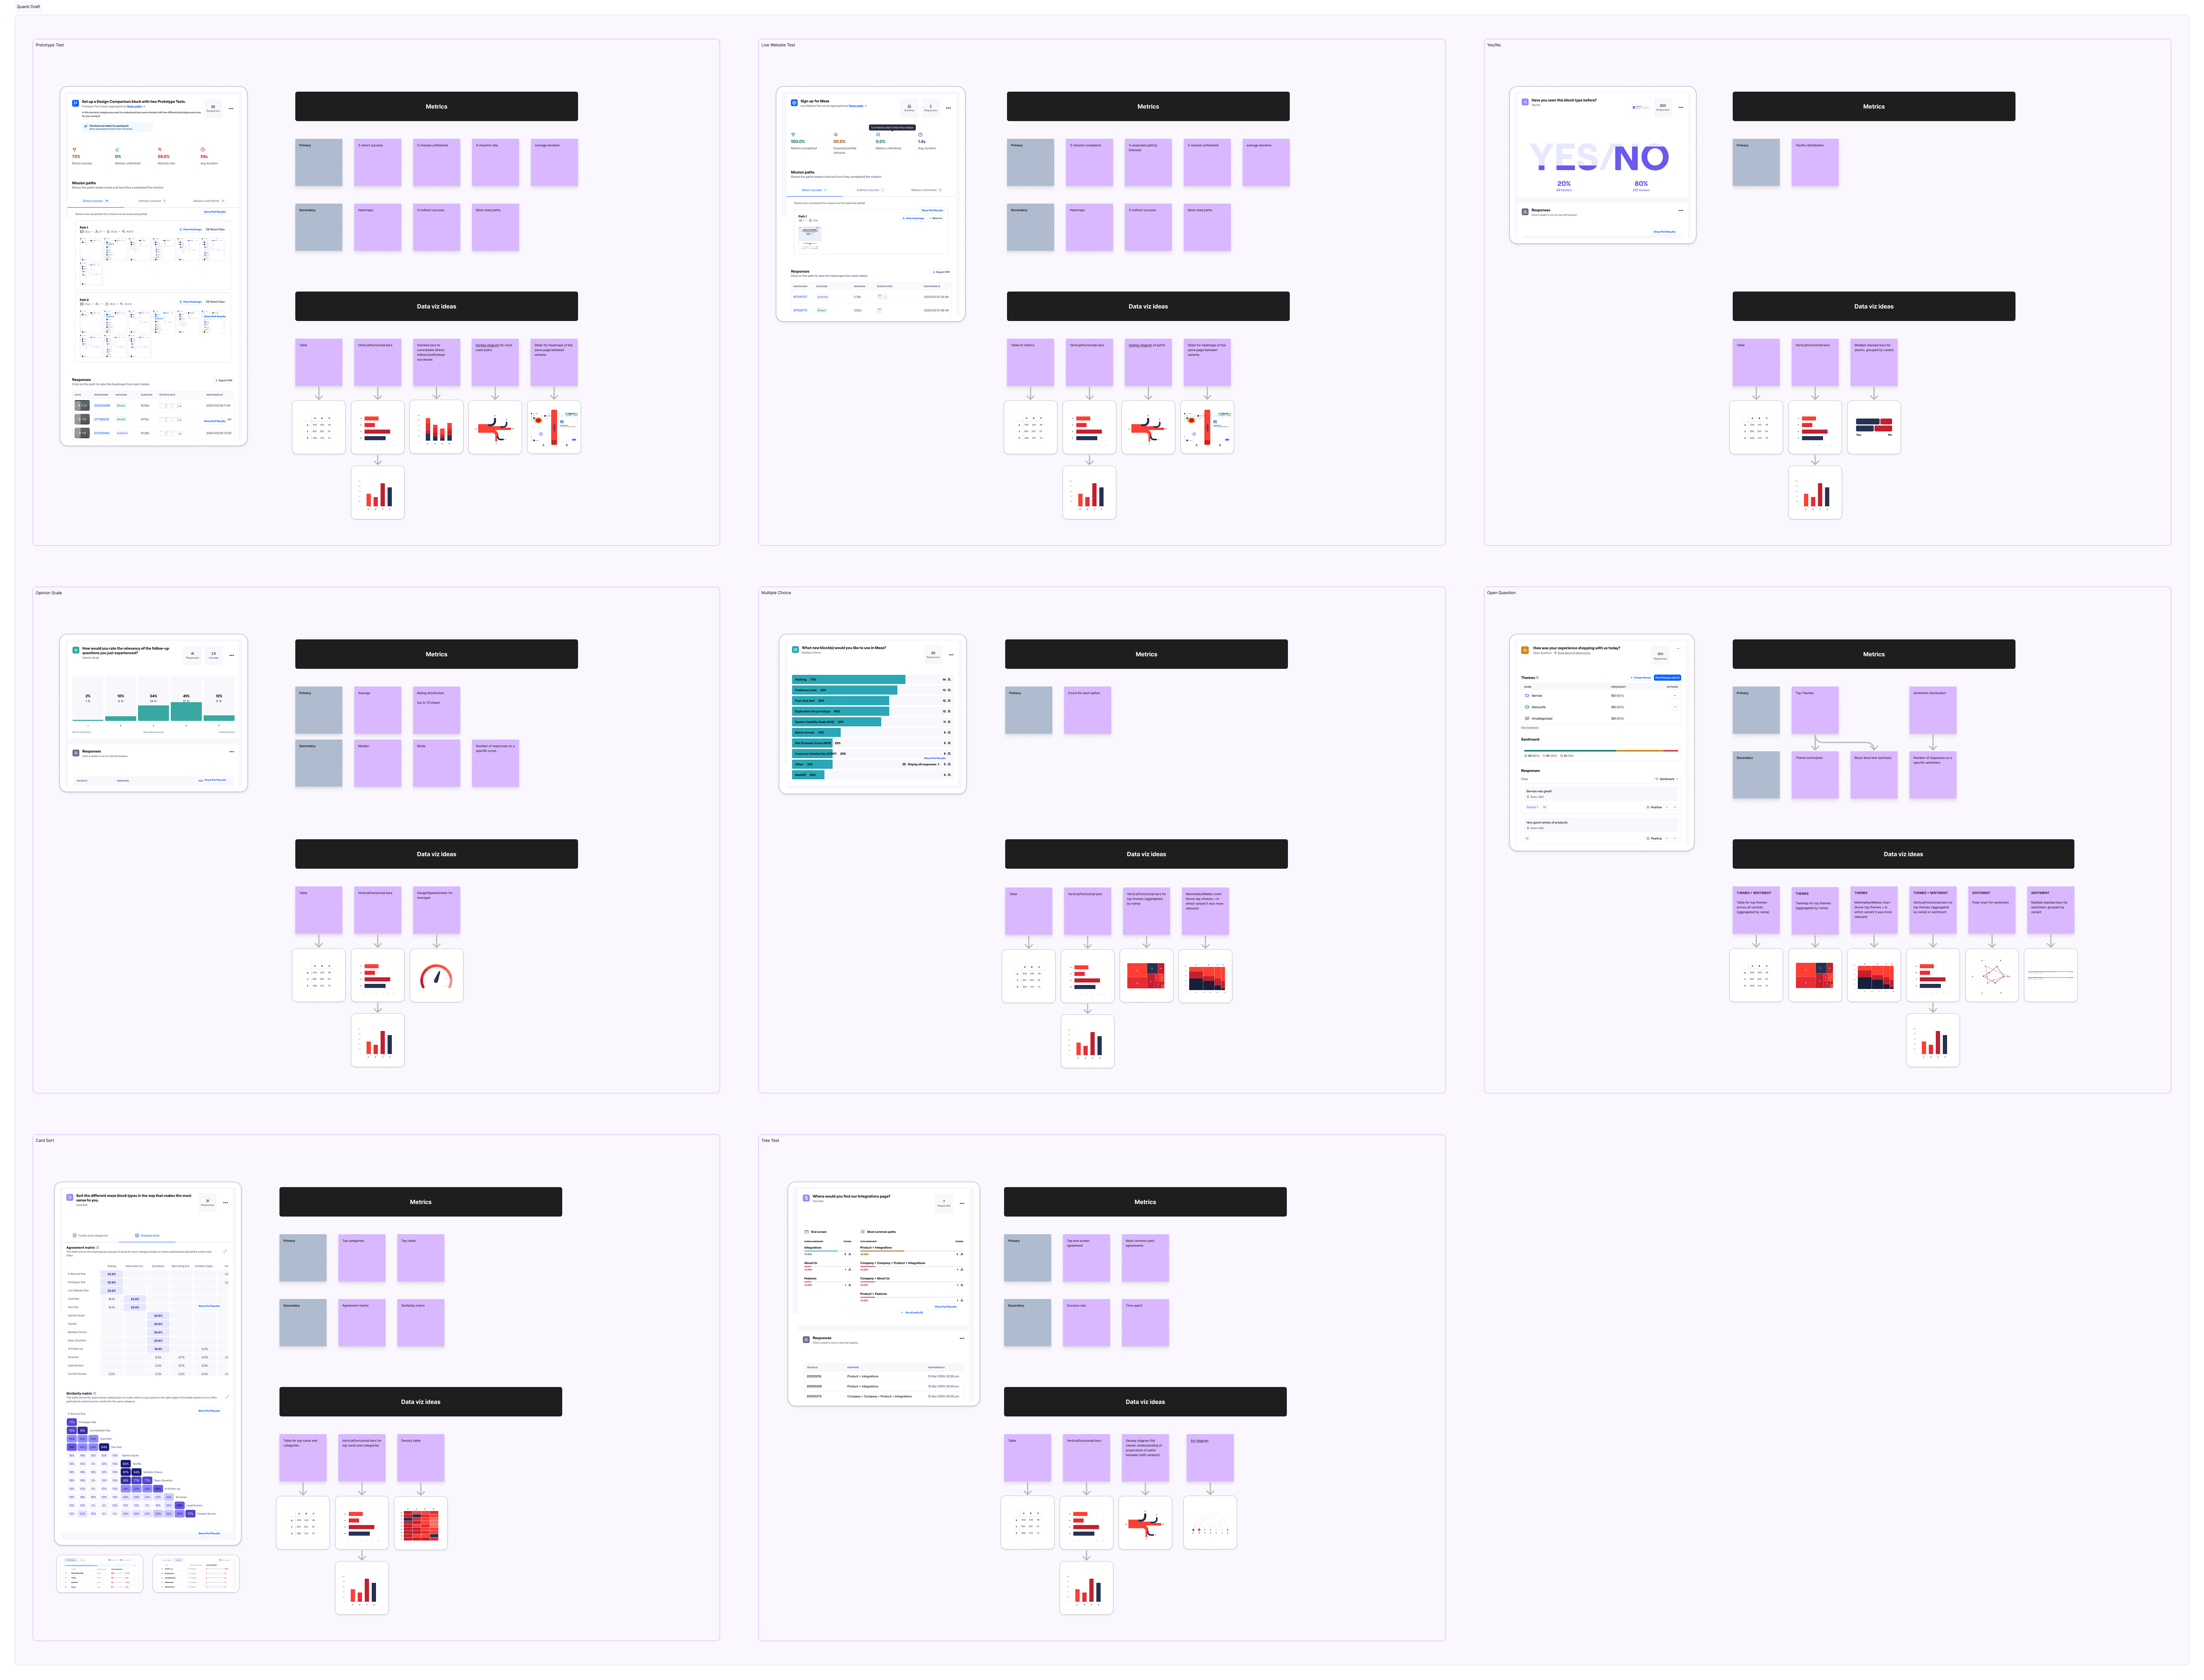
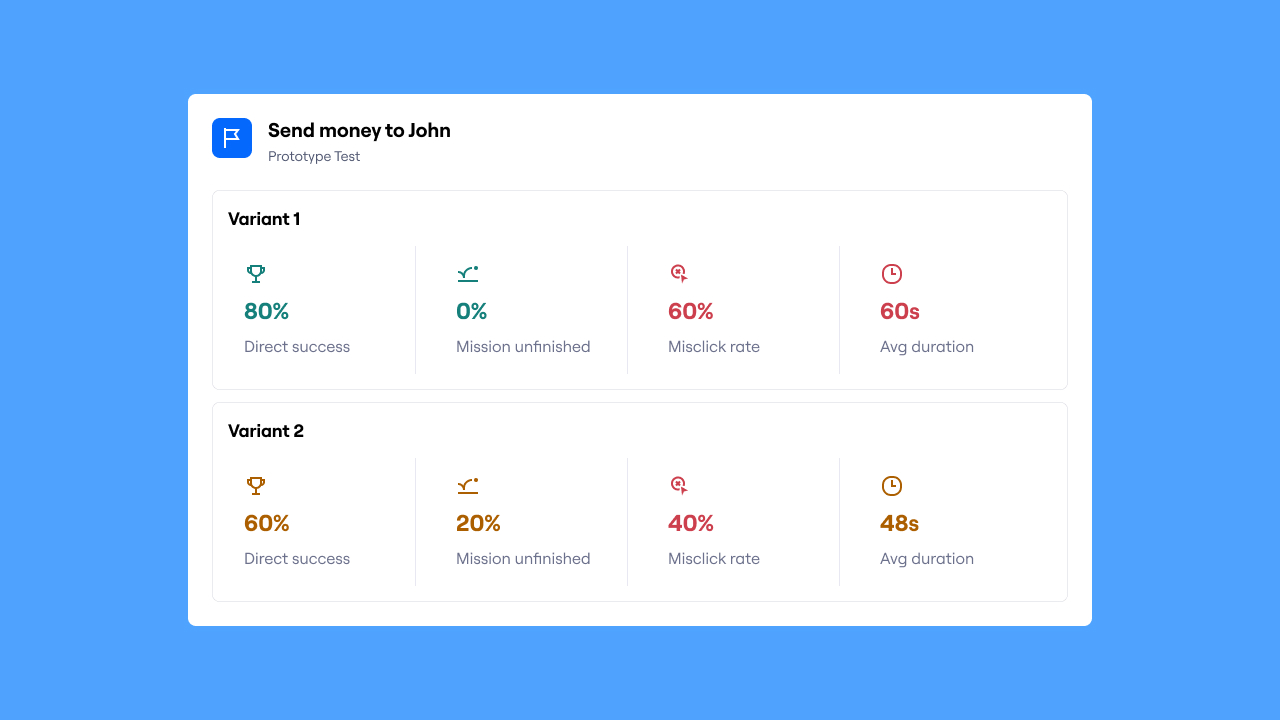
I mapped block types to their metrics and worked with stakeholders to define what could be meaningfully compared, intentionally leaving some complex blocks out based on usage data.
Maze lacked a comparison-ready data visualization system.
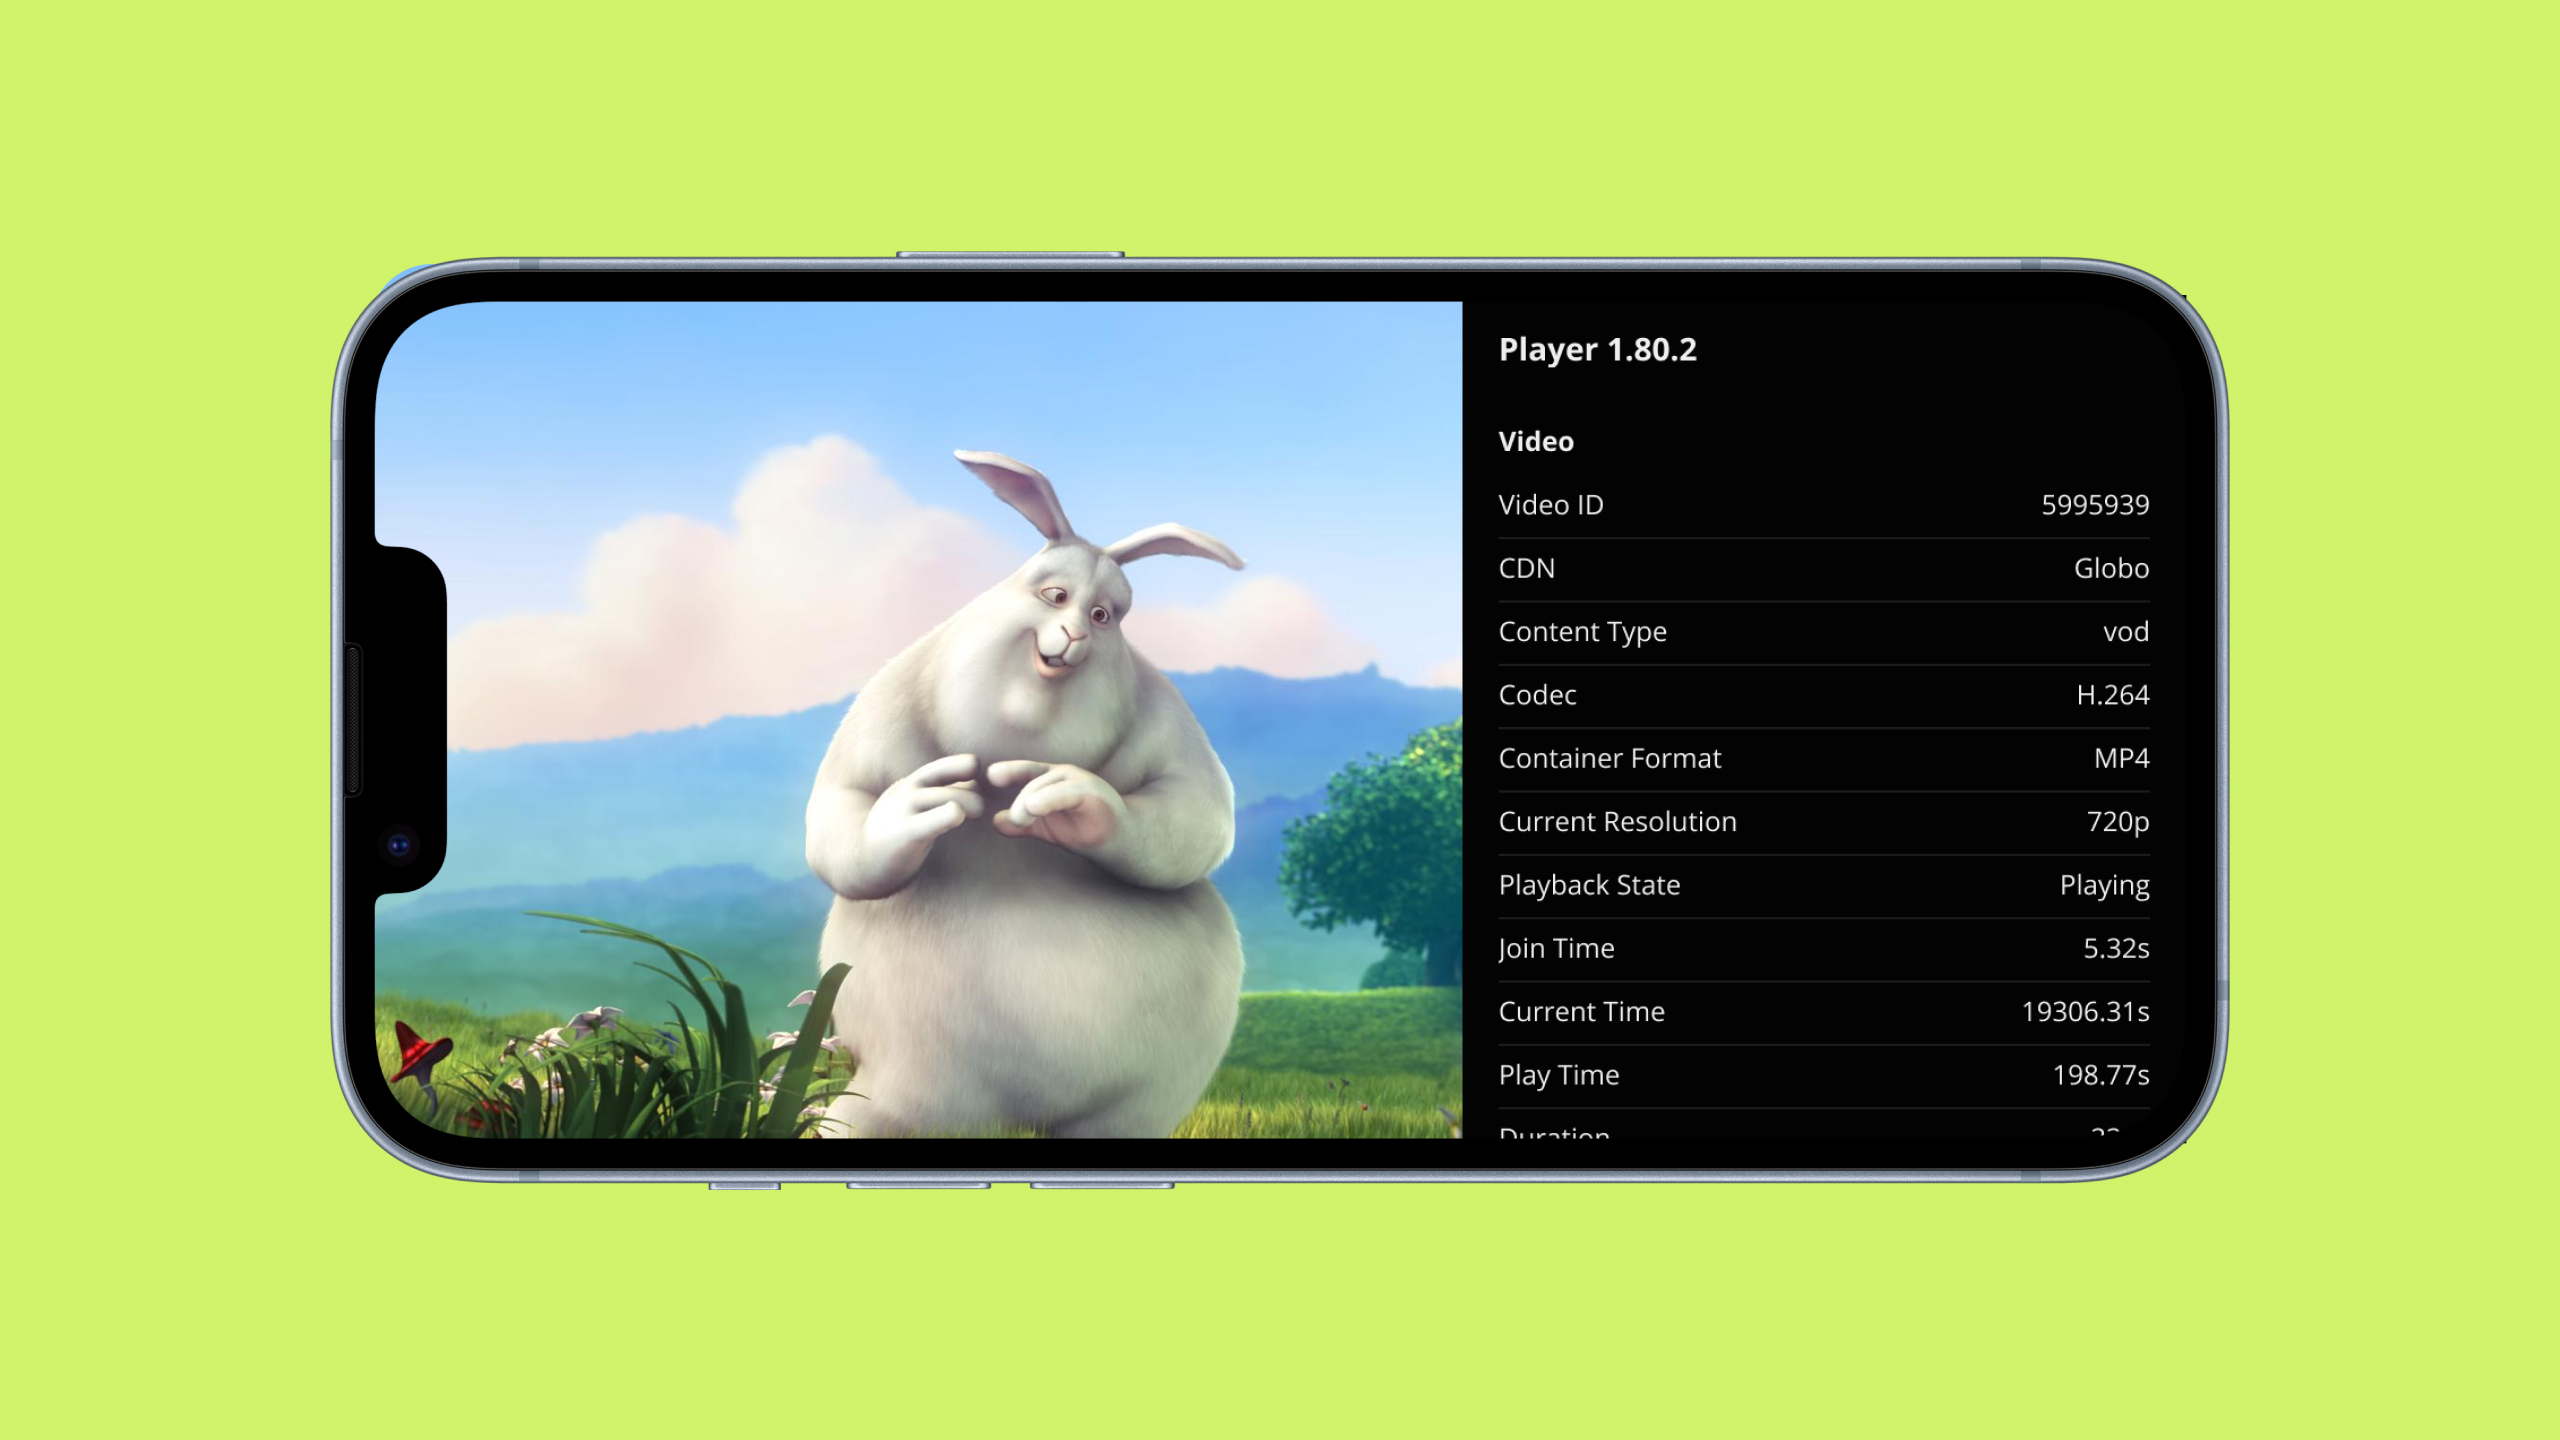
To unlock value quickly, we shipped a lightweight MVP for Prototype Test comparisons using existing components, while a more robust system was built in parallel.
I designed a new data visualization system that was responsive, accessible, and scalable across multiple block types and platform areas.
This came with some big decisions, such as defining an accessible data viz color palette and deciding how expressive we wanted our brand to be.
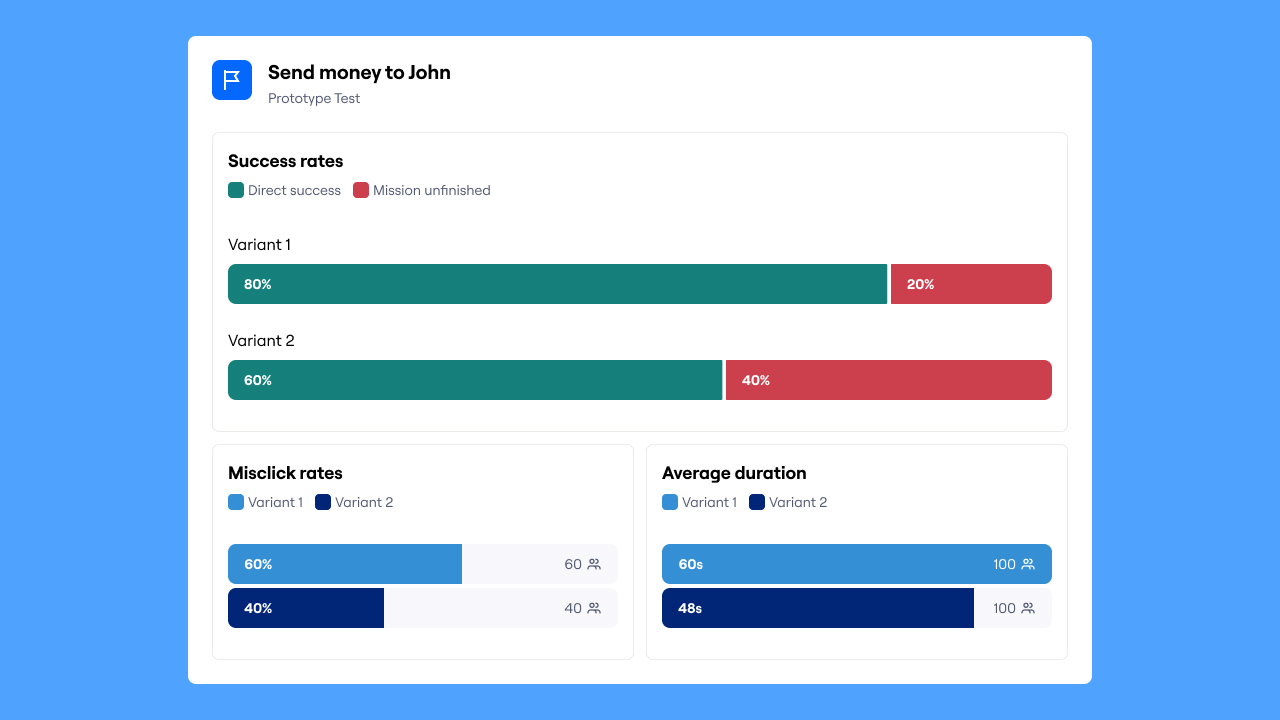
Follow-up research validated usability and if the surfaced comparisons met expectations. This led to refinements in how metrics were presented, while additional requests were tracked without expanding scope.
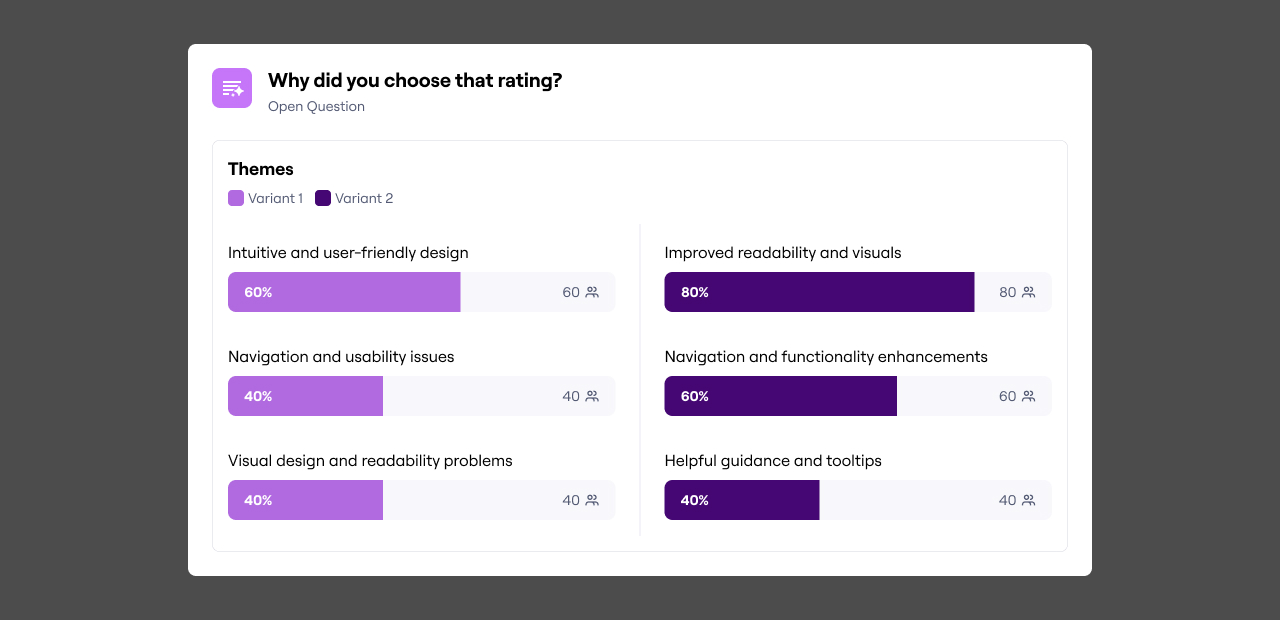
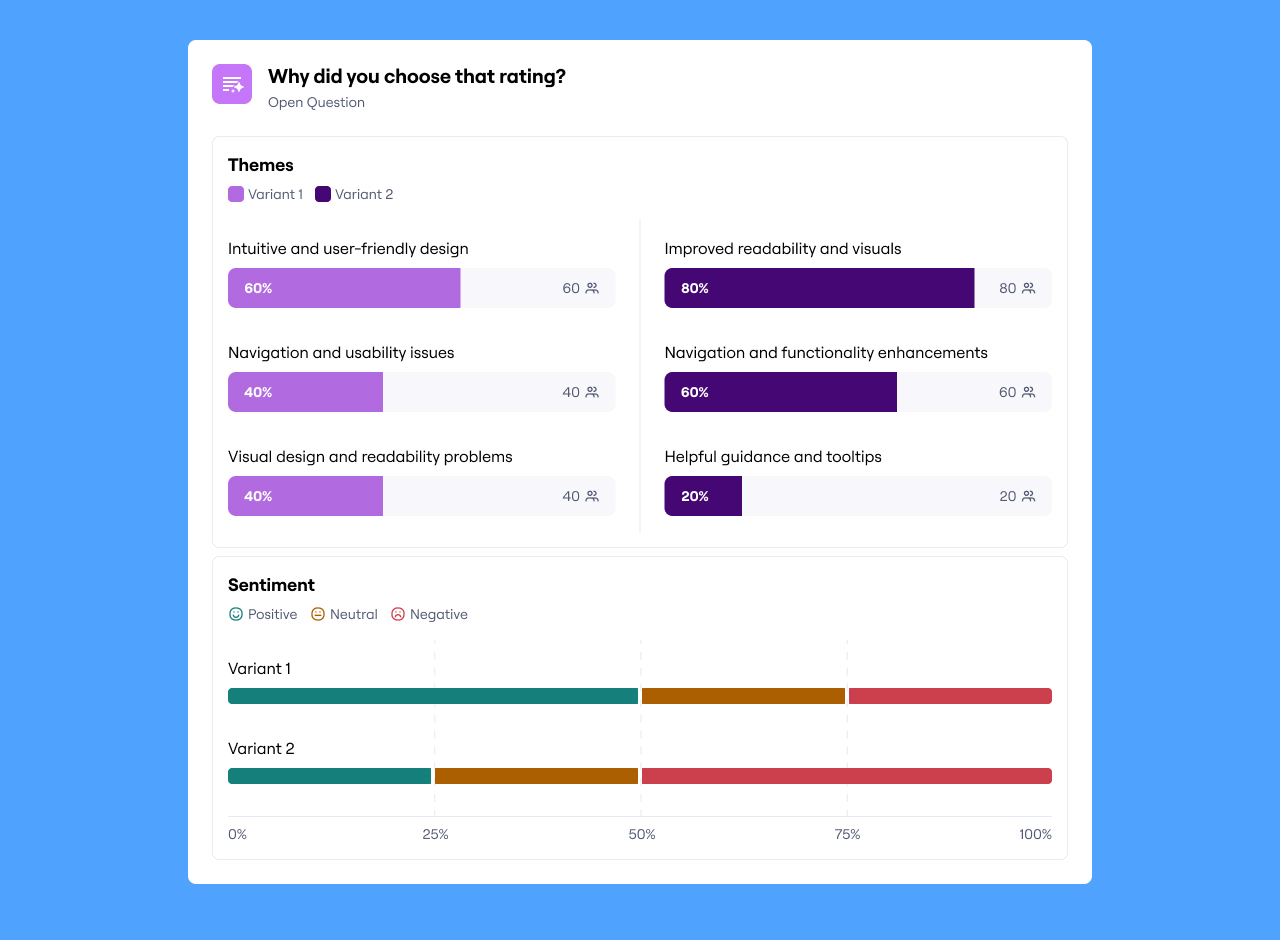
Sentiment was easy to compare using the new data viz system.
However, themes were defined at the block level rather than the study level. Normalizing them globally would have required a much larger platform effort, so we intentionally avoided it.
I facilitated a workshop with designers and key stakeholders to explore alternatives. Two main directions emerged:
I prototyped both approaches and used the recently launched Variant Comparison block to compare them directly. Research showed that:
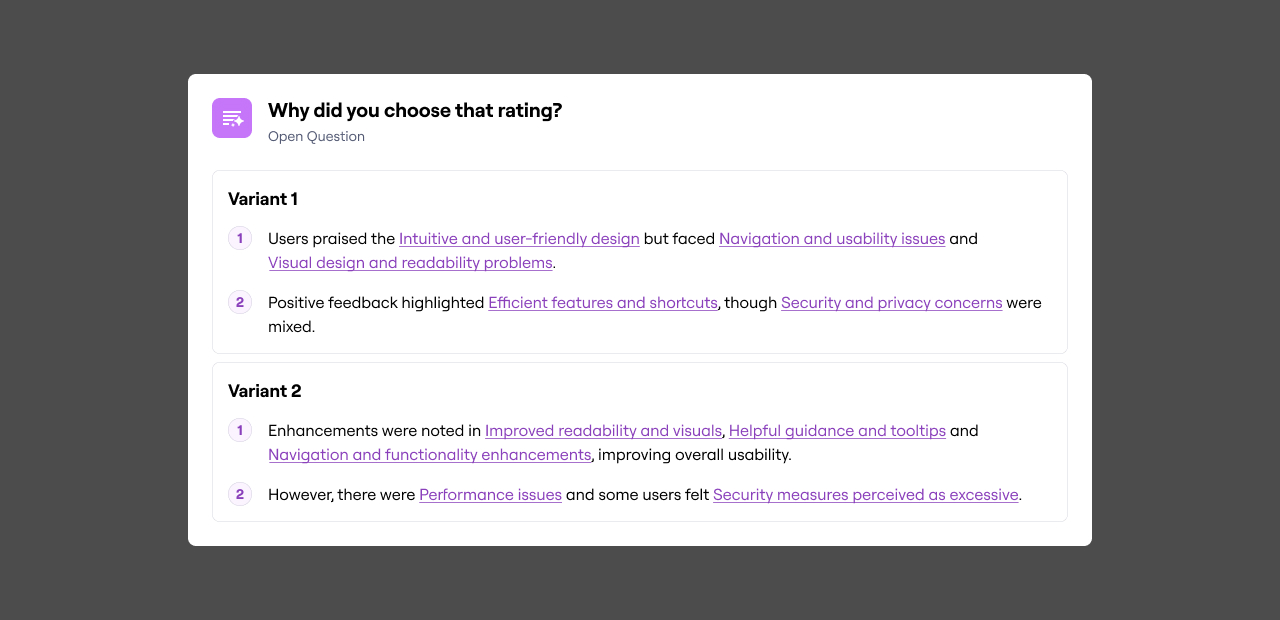
- Charts were faster to scan and provided the quantitative grounding researchers wanted
- AI summaries were valuable for nuance, but required significant customization to meet expectations.
We shipped theme comparisons using charts, sequencing AI summaries as a future enhancement.
Variant Comparison shipped iteratively, addressing a $2M ARR feature request and increasing product satisfaction.
It became a competitive differentiator, supporting new deal wins and replacing painful workarounds.
The new data visualization system extended beyond this feature and was reused across the product.
This project reinforced the importance of sequencing and restraint in product and design work. With more time and resources, AI-assisted insights would be a natural next step to further reduce time to insight.